
Inspecting Data Quality#
After loading and initial inspection of raw gaze data, the next step is to assess data quality. High-quality data is essential for reliable analysis and interpretation of eye-tracking results. Common data quality issues include missing data, noise, drift, and artifacts caused by blinks or head movements.
Inspecting Data Loss#
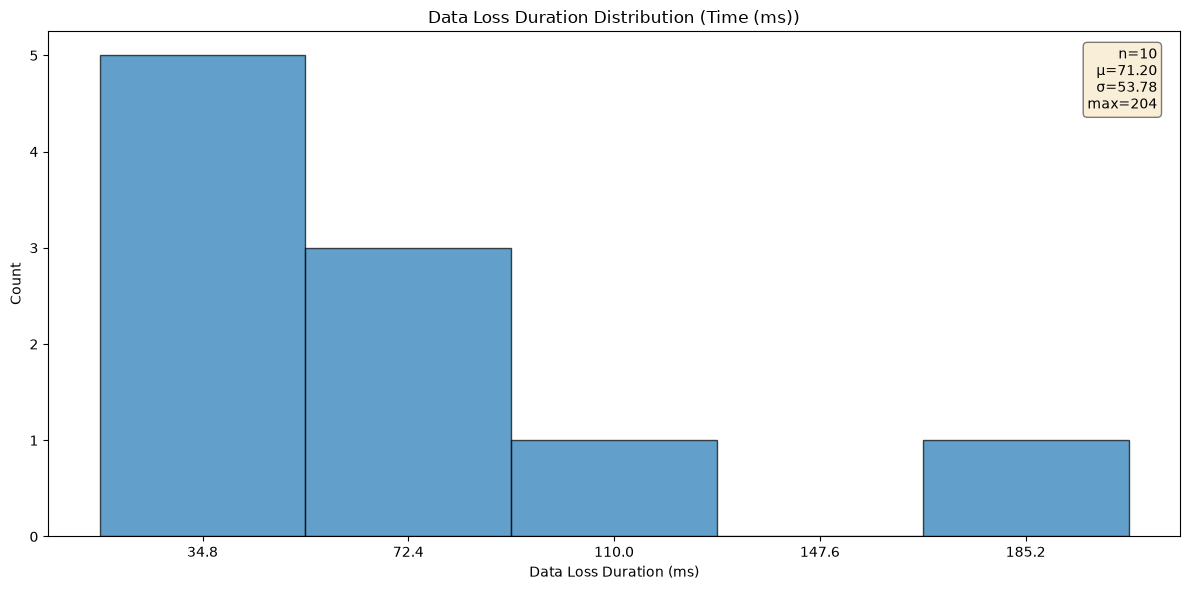
Data loss can occur during tracking due to blinks, tracking errors, or
participants looking away from the screen. The length and frequency of
consecutive data-loss segments are useful indicators of overall dataset
usability. The function data_loss_histogram() plots
the distribution of consecutive missing-data chunk lengths (expressed in
samples or time), which makes it easy to see whether loss is mostly
brief (e.g. short blinks) or prolonged (e.g. long tracking failures).
Interpretation#
Short, infrequent gaps often reflect normal blinks or brief signal dropouts and are commonly tolerated or interpolated in preprocessing. A large number of long gaps suggests severe tracking problems and may warrant re-collection or exclusion of affected trials or participants.